Weeks of analyst time
A launch forecast or a program read-out from a consulting team takes weeks: cleaning the data, building the model, writing the deck.
Vela does the whole engagement, from auditing the client's data to the read-out, in hours or days instead of weeks. Every number is traced to its source and to the code that computed it.
Early access is by invitation, for expert consultancies and biotech teams.
The problem
A launch forecast or a program read-out from a consulting team takes weeks: cleaning the data, building the model, writing the deck.
A figure in a slide rarely says which file, which formula or which assumption produced it. A chat model's answer says even less.
Few forecasters can show how their method would have done on past launches, using only what was known at the time.
What it does
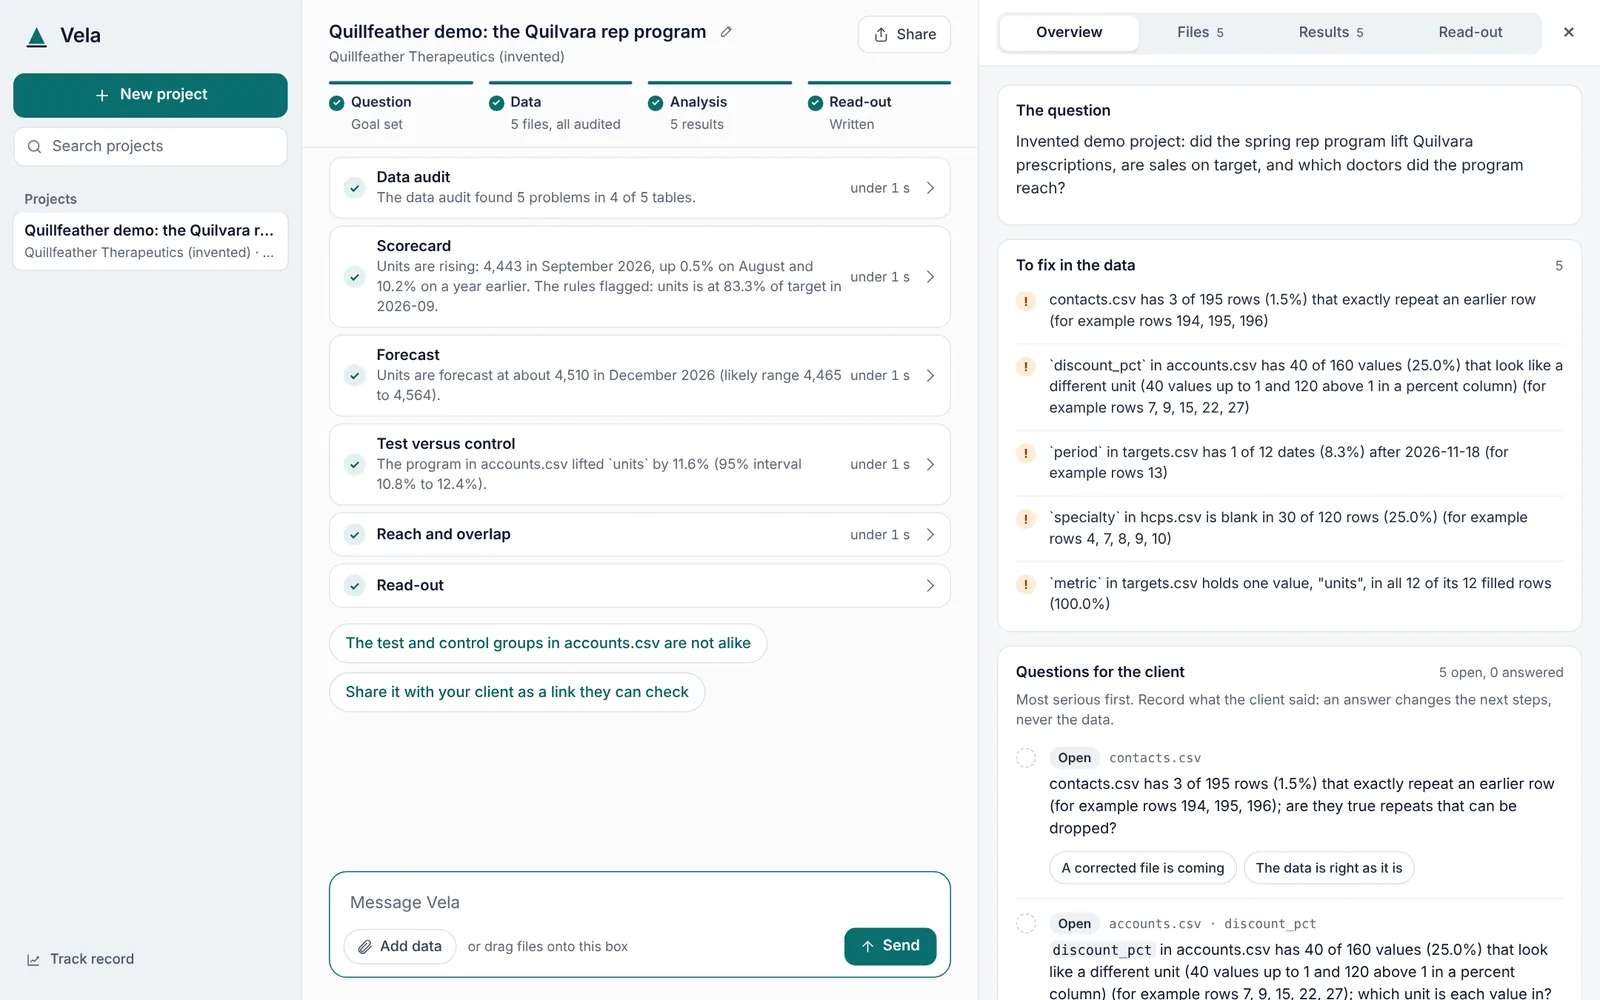
Open a project, add the client's files and ask the question. Vela does the work with its tools, shows each result beside the conversation, and suggests the next step.
What is in each file, what is missing, what looks wrong, and the questions to put to the client.
Scorecards against targets, trends, reach and overlap across channels.
Three-year US net sales for a drug launch, from several methods, each backtested on past launches.
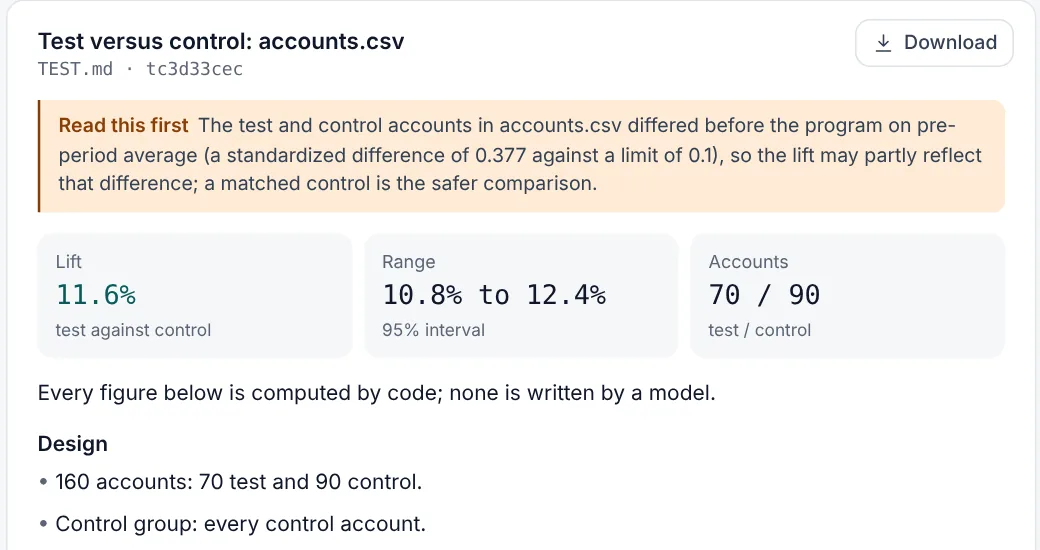
Did the program work? The lift, with a range, and a warning when the groups were not alike to begin with.
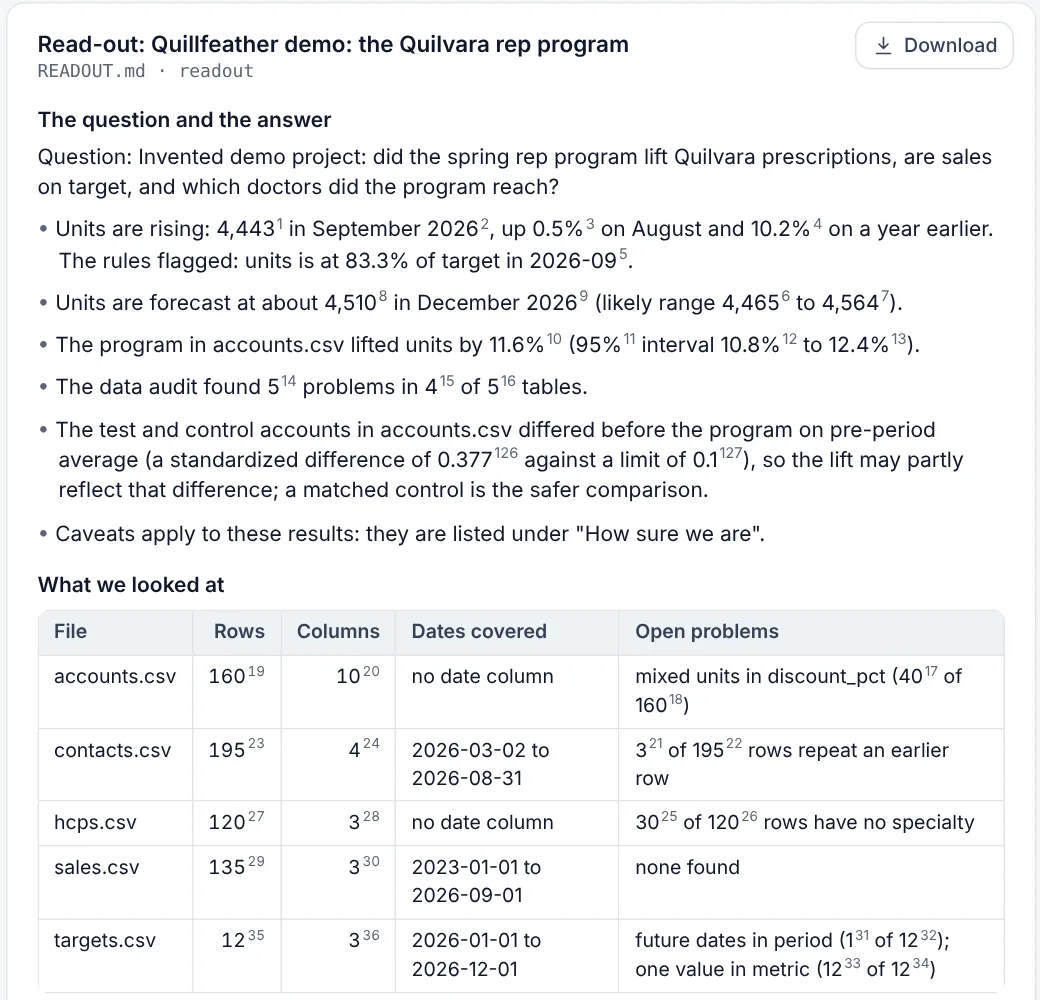
A client-ready summary written only from traced results, with every figure checked before it is shown.
A read-only page where every figure opens to show the data and the calculation behind it.
Why Vela
A general AI model can run a forecast on data it is handed. Vela holds the whole project, and it is built so the work stands up to review.
Each figure links to its source data and to the code, and the code version, that computed it.
The AI gathers inputs, runs tools and writes. It never does the math, and a write-up whose numbers don't match a recorded result is refused.
Forecasting methods are tested on real past launches, each using only what was known before its launch date.
Experts teach Vela their method in the Method Builder: an interview, then a Method Card, then the build and a backtest on past launches. The method stays private to its author unless they choose to publish it.
Each client's data lives only in that client's private workspace. It never trains shared models or methods, and separation is enforced by the system's design, not by the AI's judgment.
Proof, so far
In a walk-forward backtest, each past launch is forecast using only information available before it launched, then compared with the sales that followed.
59 past US drug launches with separately reported sales. The naive baseline is the simple forecast any method must beat; a method ships only if it does. Figures change as the dataset grows.
Who it's for
Small firms and independent consultants who forecast and analyse for pharma clients. Take on more projects with your own methods, and hand clients work they can check line by line.
A fast, defensible second opinion before licensing a drug or planning a launch, without a multi-week consulting project.
Team
Co-founder & CEO: product and engineering
Co-founder: data and customers
We are inviting a small number of expert consultancies and biotech teams to try Vela on their own kind of project.
Request early access